Protocols

Setting Instrument Voltages

When setting voltages it should be understood that all photomultiplier tubes (PMTs) operate optimally within certain ranges. The factors influencing detector performance can include, but are not limited to: systemic electronic noise, detector quantum efficiency, optical filter quality, laser alignment, detection wavelengths, and the voltage applied to the PMTs.

Since all cells are variable with respect to their background autofluorescence, there is no “one size fits all” group of instrument settings that can be universally applied to the PMTs on a particular flow cytometer. Moreover, instrument settings for negative populations should not be arbitrarily assigned to low fluorescence values (as was done in older systems), but through a more methodical process; it is known that insufficient gains (voltage) can decrease resolutions between negative and positive populations, whereas high gain values can push very bright populations off-scale making them less easy to quantify.

When these procedures are followed, cytometer performance will be traceable over the long term, as is often necessary when repeating the same experiment many times or in clinical trials. In order to limit the influence of external factors when establishing instrument settings, the following guidelines should be followed:

  • Unstained cells at a concentration of 3 – 5 million cells/mL for 10 – 20 measurements.
  • A spreadsheet with the extracted flow cytometer baseline data for the current bead lot with an additional column for 2.5 robust standard deviation (rSD).
  • Retrieve the baseline data from BD Cytometer Setup and Tracking (CST) software as follows:
    • CYTOMETER MENU → CST → Find the Baseline for the current bead lot → Right click on the file name and select Export.
    • Relabel the file with your name and experiment e.g. [insert your name]_[experiment]_Panel [date]

Table 1: Example Baseline Data for BD Cytometer Setup and Tracking Beads

Part 1: Rules For Setting Flow Cytometer Voltages

The minimum PMT voltage setting for each detector is determined so that the resulting rSD of the unstained cells is approximately 2.5x the rSD of the electronic noise (2.5 rSDen). 

Purpose: to ensure that electronic noise does not interfere with measurements with dim fluorescence and/or negative events and that you are aware of these limits should it be necessary to decrease the voltages lower than these values in Rule 2 (below).

The Short Way:

  • Use the application settings features of BD FACS DIVA (grey plot regions) to help place your negative cells at 2.5x rSDen.
  • Refer to your training notes for instructions on how to set this up (University of Toronto Flow Cytometry Facility Core Clients Only)

The Long Way:

  • Create a plot of FSC and SSC and gate the cells of interest.
  • Create a Statistics Box and select the FSC x SSC population (P1) and the rSD values from the statistics tab for every parameter.
  • Sequentially record data files of at least 5000 events starting from the CST voltages, reducing the voltage in increments of 25 until the rSD of the unstained cells comes into line with the values calculated in the last column of the baseline report spreadsheet (refer to Table 1’s example).
  • Make a note of these voltages on a worksheet – these are the minimum voltages that may be used to ensure that no more than 10–20% of electronic noise contributes to the biological background of the sample.
    • Data from a statistics box can be exported to an Excel worksheet with the desired information.
    • The minimum acceptable voltage can be extrapolated by plotting rSDen voltage on a graph.

The Short Way:

  • Acquire data for a fully stained tube of cells and reduce the voltages for any detectors where data is off scale positively.
  • Ensure to leave enough room at the top of the FSC vs SSC plot so that unexpectedly bright positives can still be captured on scale.

The Long Way: 

  • Refer to the Linearity Max Channel column of the extracted baseline report; the median fluorescence intensity (MFI) of your fluorochrome should not exceed this value.
  • Create a statistics box with the MEDIANS for each fluorescent parameter and acquire data for cells stained with one color only (or with colors that are well-separated and have no spectral overlap).
    • Note: The measured fluorescence must be biologically relevant therefore beads cannot be used in this process.
  • If there are populations with a larger spread (wide %CV’s) decrease the voltage so that the brightest events remain within the linear range of the detector.
  • There should always be some extra room at the top of the scale to accommodate events that have unexpectedly high fluorescence.
  • Compensation controls should also fall within the linear range of the detector.
    • If the compensation controls are too bright, it is best to remake the samples with lower antibody concentrations as opposed to decreasing voltages to accommodate the bead fluorescence.

If the positives are so far up the scale using the minimum acceptable voltage that they are in the nonlinear range or going off scale, the voltage must be lowered to properly view the positive data regardless of where the negatives reside.

Placing negative cells at 2.5x rSDen does not always result in the best resolution between the negative and positive fluorescence. For example, at the minimum voltage, the separation between negative and positives can be reduced when compared to voltages closer to the CST values; this can consequently have a negative impact on the detection of weakly expressed antigens. Alternatively, when too much voltage is applied, negative populations can spread, especially in channels where there is little to no detectable autofluorescence (red emissions), therefore it is important to optimize the resolution of all stains, paying particular attention to dim fluorochromes and weakly expressed markers, to ensure their correct identification by characterizing the Stain Index over a wider range of voltages.

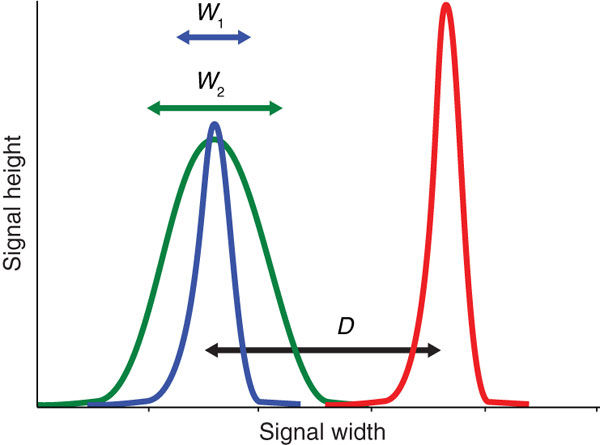
Figure 1:  The effective brightness of a reagent depends on the difference (D) between the positive (red) and the negative (blue, green) populations and the spread of the negative population (W). The stain index is a useful metric for normalized signal over background (Maeker & Trotter 2008).

The following method will help to minimize the spread of the negatives while optimizing the resolution of the stains for each detector.

Procedure: Acquire data for the single stained control cells, over a wider range of voltages to determine where the best resolution is obtained. Use this voltage instead of the rSDen as your starting voltage.

  • Draw histograms for each parameter and draw positive and negative interval gates on the plots.
  • Create a statistics box with the MFIpos, MFIneg and SDneg for each parameter.
  • Create a spreadsheet on which you can input data directly from BD FACSDIVA statistics to calculate Stain Index as you change voltages. (you may also export the statistics from BD FACSDIVA and format the resulting table for this calculation).
STAIN INDEX = [MFIPOS – MFINEG]/(2.5x SDNEG)
  • For populations that smear (no easily identifiable negative/positive boundary) set some unstained aside so that each time you change the voltage, data is acquired for the negative cells alone, in addition to the stained cells.
    • Use the negative cells alone in the stain index calculation (MFIneg).

Part 2: Creating Software Application Settings

BD FACSDiva™ based “Application Settings” are used to standardize your experiments across time and between instruments. If the CST program has changed the system voltages to separate the dim bead population apart from noise, the software will automatically adjust your specific application settings, to a proportional degree, so that populations will appear in the same position on the scale each time the CST values are updated (daily).

  1. After fully optimizing your experiments.
  2. After new baseline measurements are recorded, for example, when a new bead lot is used.
  3. When transferring experiments between different instruments.

Procedure:

  • At the experiment level, right click on the Cytometer Settings, scroll down to application settings, SAVE.
  • Name the settings as follows: [insert your name]_[experiment]_Panel [date].
  • Creating a new global worksheet: In the browser, right click on the global worksheet icon in the experiment and select “New Global Worksheet” from the drop down menu.
    • Create histograms for each fluorescence parameter plus a primary plot for FSC VS SSC.
    • Place a tight gate around the main rainbow bead population on FSC VS SSC.
    • Create interval gates on the histograms.
    • Create a statistics box for each histogram and edit the stats to include the MEDIAN for the fluorescent parameter and interval gate with which it is associated.
    • Create a text box that displays the medians for each detector.
  • Record an uncompensated data file for the rainbow beads.
    • Label the tube with the bead type and Lot Number, for example: RCP – 38 – 3A, Lot AF02.
  • Create a text box and record the medians for each channel in your experiment (so it will be there for every run).
    • If using multi-peak rainbow beads, make sure to identify which peak was gated (so the same peak is always targeted).
    • Record bead targets in your lab book (for an offline reference).
  • When repeating experiments, apply saved application settings to the experiment, acquire the rainbow bead data, and compare to recorded targets.
    • If there is  greater than +/-5% difference between the targets and the readout,  adjust voltages to bring readings closer to the reference values.
  • If transferring one’s experiments to a new cytometer:
    • Use the rainbow bead targets obtained from the other instrument(s) and adjust voltages to bring the MFIs of the bead florescence to the reference values.
    • Save new application settings.
    • Save the experiment template so the bead target worksheet is accessible for future runs.
IMPORTANT:  RAINBOW TARGETS WILL VERIFY THAT THE APPLICATION SETTINGS HAVE BEEN SET CORRECTLY – THESE READOUTS VARY BETWEEN BEAD LOTS.
  • When lots change, data files that correlate old targets from earlier lots to new lots must be recorded.
    • The data must be acquired on the same day, with the same voltages.
  • The MFIs of the fluorochromes may be different between lots therefore it is important to note this on your template by updating the reference values.
PRODUCT NAME:  ULTRA RAINBOW CALIBRATION PARTICLES, KIT

RCP Manufacturer:  Spherotech, Catalogue No: URCP-38-2K

There are six peaks of fluorescence in these beads; choose the peak that best suits your data.  Use this same peak to match your MFIs  each day. Recommended for experiments with many red detection parameters and UV excitations.

PRODUCT NAME:  SPHERO RAINBOW FLUORESCENT PARTICLES (MID-RANGE) 3.05 UM, 5ML.

Manufacturer:  Spherotech, Catalogue No:  RFP- 30-5A

These beads have poor red/far-red fluorescence and do not work for UV excited fluorochromes.  Best for FITC/PE/PE-Cy5 and violet excitations

Rainbow beads may be purchased directly from the manufacturer (spherotech.com) or Cedarlane Laboratories.

Baumgarth, N. & Roederer, M. (2000). A practical approach to multicolor flow cytometry for immunophenotyping. J. Immunol. Methods, 243, 77–97.

Maeker, H.T., & Trotter, J. (2008). Selecting reagents for multi-colour flow cytometry with BD™ LSRII and BD FACS Canto™ systems. Nature Methods, 5, Application Note.

Maecker, H.T., Frey, T., Nomura, L.E. & Trotter, J. (2004). Selecting fluorochrome conjugates for maximum sensitivity. Cytomety A, 62, 169–173.

Standardizing Application Setup Across Multiple Flow Cytometers Using BD FACSDiva Version 6 Software – Technical Bulletin.

Learn More

Intro to Flow

Applications

Protocols

Resources

Work Around Very Talented People

Meet the friendly and diverse team that keeps the University of Toronto Flow Cytometry Facility running on a day-to-day basis.

Room 7226, Medical Sciences Building, 1 King’s College Circle, Toronto ON, M5S 1A8

Phone:416-978-6524

Copyright ©2023 Temerty Faculty of Medicine Flow Cytometry Facility. All rights reserved.